Skip to content
← All release notesNewanfra Core0.23.0

View underlying data for every measure

View underlying data now works on any measure: dataset metrics, ratios, filtered measures, and measures defined in the query.

Right-click a chart point and pick View underlying data. A measure built from several models, such as revenue across order items and products, offers one view per model.
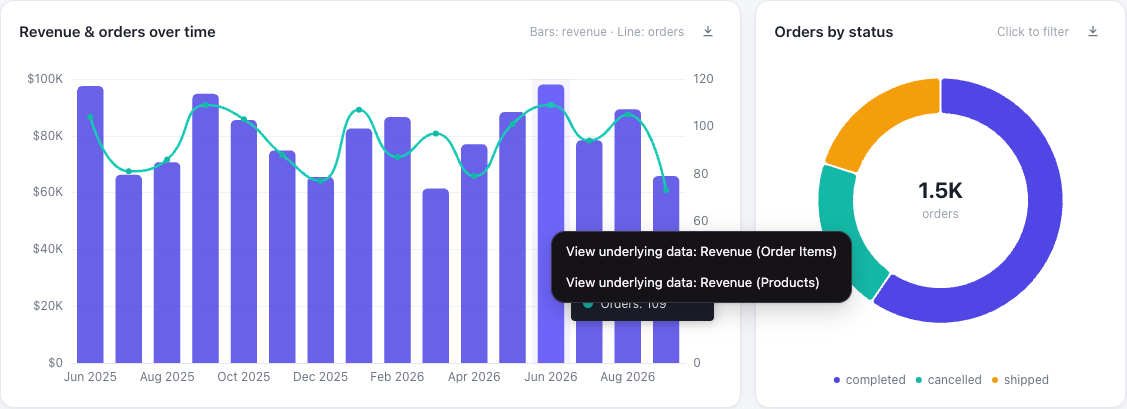
A revenue and orders chart with a right-click menu on the Jun 2026 bar, offering View underlying data: Revenue (Order Items) and View underlying data: Revenue (Products)

The rows show the measure as a column, so you can check the number.
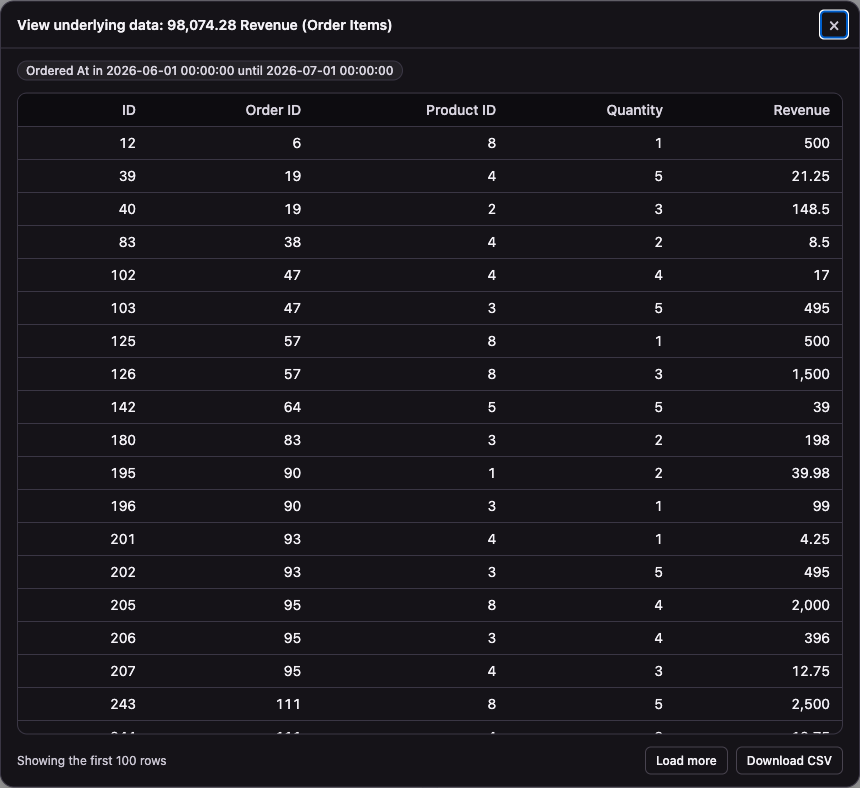
The View underlying data modal for 98,074.28 Revenue (Order Items), filtered to orders in June 2026: a table of order item rows with ID, order ID, product ID, quantity and a Revenue column, with Load more and Download CSV buttons

It shows on charts that open the menu with query.menu(). Learn more (opens in a new tab)

Full changelog (opens in a new tab)